Tambellini StarChart™ Will Help Institutions Navigate Modernization Options, Technology Selections
Senior Analyst

To identify objects in the universe and orient themselves, astronomers, stargazers, and others use star charts — celestial maps that make it easier to navigate the vast night sky based on an individual’s location and time of year.
These maps served as the framework for the Tambellini Group’s latest guide for higher education technology — The Tambellini StarChart™.
What is the Tambellini StarChart?
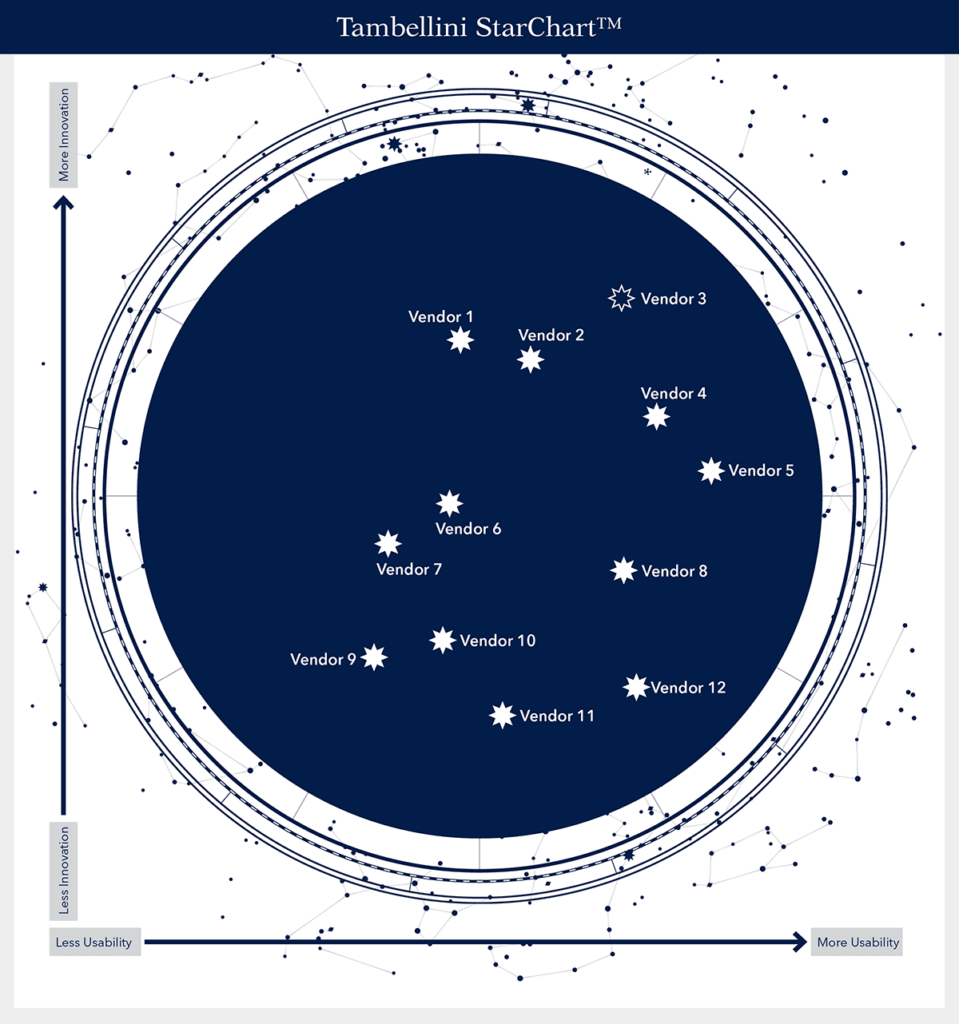
The Tambellini StarChart is a visualization tool that helps higher education institutions navigate the complex technology landscape and make more effective and efficient decisions when selecting new technology.
Founded on our renowned data, research, and experience, the Tambellini StarChart positions products based on a proprietary evaluation of Usability and Innovation — crucial differentiators in technology investments. Using this research, analysis, and visualization, higher education technology leaders can use the StarChart to evaluate which solutions are the best fit for their institution.
The first Tambellini StarChart will be released in August 2023 and will provide a visual guide for Student Systems. Additional StarCharts, which will be released throughout 2023 and 2024, will provide support for technology selections in:
- Finance
- Human Capital Management (HCM)
- Advancement
- Recruitment and Admissions
- Student Success
- Teaching and Learning
Time-Saving, Consensus-Building Research for Higher Education Leaders
Tambellini analysts, myself included, are former CIOs and technology leaders at higher education institutions. We have helped our campuses — and now, our clients — select the right products to modernize and solve complex problems. The technology identification, evaluation, and selection process is a lot of work, and we know it can often feel like you are starting from scratch every time a need arises.
Navigating all your technology options, down selecting to a reasonable number of solutions, and finding the best fit can be extremely complicated. Higher education leaders must consider:
- Cost
- Market presence
- Usability
- Functional breadth
- Innovation
- Integrations with existing systems
That’s why the Tambellini analysts, armed with extensive expertise and unwavering dedication to research, have meticulously crafted these StarCharts to help you map the optimal path of modernization and sustainability for your institution.
The Tambellini StarChart is the only visualization tool in the market focused exclusively on the higher education vertical.
How to Use the Tambellini StarChart
Users can instantly spot their ideal mix of product usability, represented on the x-axis, and innovation, represented on the y-axis, to narrow their search and identify the best solutions for their consideration.

How Do We Measure Technology Usability?
Usability measures the degree of ease in using a system and the degree of breadth in suitability for users to accomplish objectives. In other words, how easy is the system to use, and to what extent does it facilitate the completion of a user’s task or objective at scale?
How Do We Measure Technology Innovation?
Innovation measures to what degree a solution addresses unique challenges and requirements with novel and/or advanced capabilities, taking into account a vendor’s capacity for sustained innovation at scale.
Data and input for the StarCharts are provided by Tambellini analysts, advisors, researchers, vendor response teams, and vendor customers.
Watch our recent webinar to gain a deeper understanding of our research methodology and how to best use this resource.
Building Your Future Campus™
Tambellini StarCharts provide institutions with a navigational guide to the higher education technology market, backed by expert research and insights from Tambellini analysts. Institutions can gain the information needed to modernize their technology and build their Future Campus.
The Future Campus is Tambellini’s vision of where innovation and cutting-edge technology converge to create a sustainable, leading higher education institution. Through the Future Campus Framework, we are ready to help you identify areas of opportunity and areas where you excel to build a resilient and competitive institution that successfully manages its people, processes, data, and technology.
Categories
- Academic Administration
- Advancement
- AI and ML
- Content Management
- CRM Platforms
- Customer Experience (CX)
- Cybersecurity
- Data Management and Analytics
- Enterprise Portals and Mobile Apps
- Event Management
- Finance
- HCM/HR
- IT Tools and Infrastructure
- Life at Tambellini
- Services
- Student
- Teaching and Learning
- Technology Leadership
- Thought Leadership
- Uncategorized
Share Article:

Other Posts From this Author:
© Copyright 2025, The Tambellini Group. All Rights Reserved.